
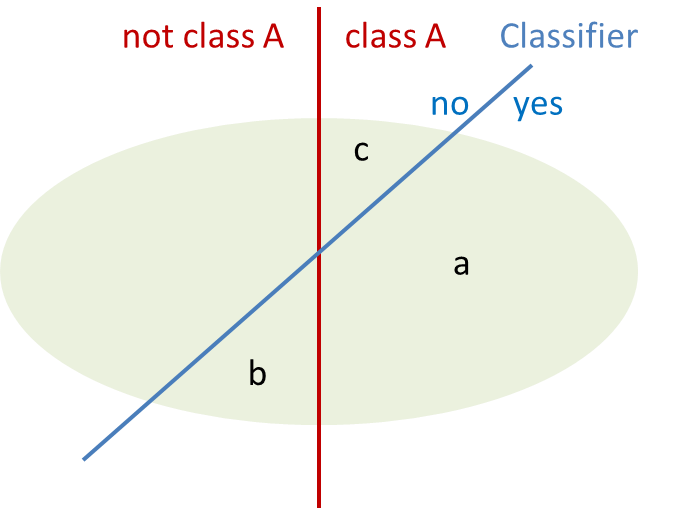
Understanding the quality of an automatic classification system is crucial for its acceptance and any attempt to improve it over time. Quality means that we need to look at errors and at the recognition rate. In classification terms these values are called precision and recall. Precision gives the percentage of documents that have been classified correctly with respect to all documents assigned by the classifier (a/a+b), recall is the number of documents classified into a class with respect to the total number of documents that should be in this class (a/a+c). In a previous post (Measuring Classification Quality) we have already discussed these and how important they are. It is easy to depict them in a graphical visualization:
While these values might appear a little abstract their advantage is that they are independent of the size of the set. But it might be more intuitive to talk about the actual number of documents that are imported into a class from other classes (set b) or exportedand lost from the class (set a). Because it becomes obvious that recall and precision are related and have the same value if no threshold is applied – as every document that is imported to a class must have been lost in another class. Also it makes it easy to look at particular problem classes with a lot of imports (attractors) or exports (donors).
For a classification system these values can be depicted in a so called confusion matrix (also known as a contingency table or an error matrix) showing all relations between classes in one glance.
Our classification designer in the Skilja Content Classification system has a built in visualization that lets you easily see the migration of documents into other classes. As an example we have used our popular Reuters news wire test set and arranged the classes in 7 hierarchical groups. If you run a 90:10 split benchmark on all 5917 documents (which fortunately only takes a few seconds because the SCC is so incredibly fast) the confusion matrix obtained for the 51 classes looks as follows:
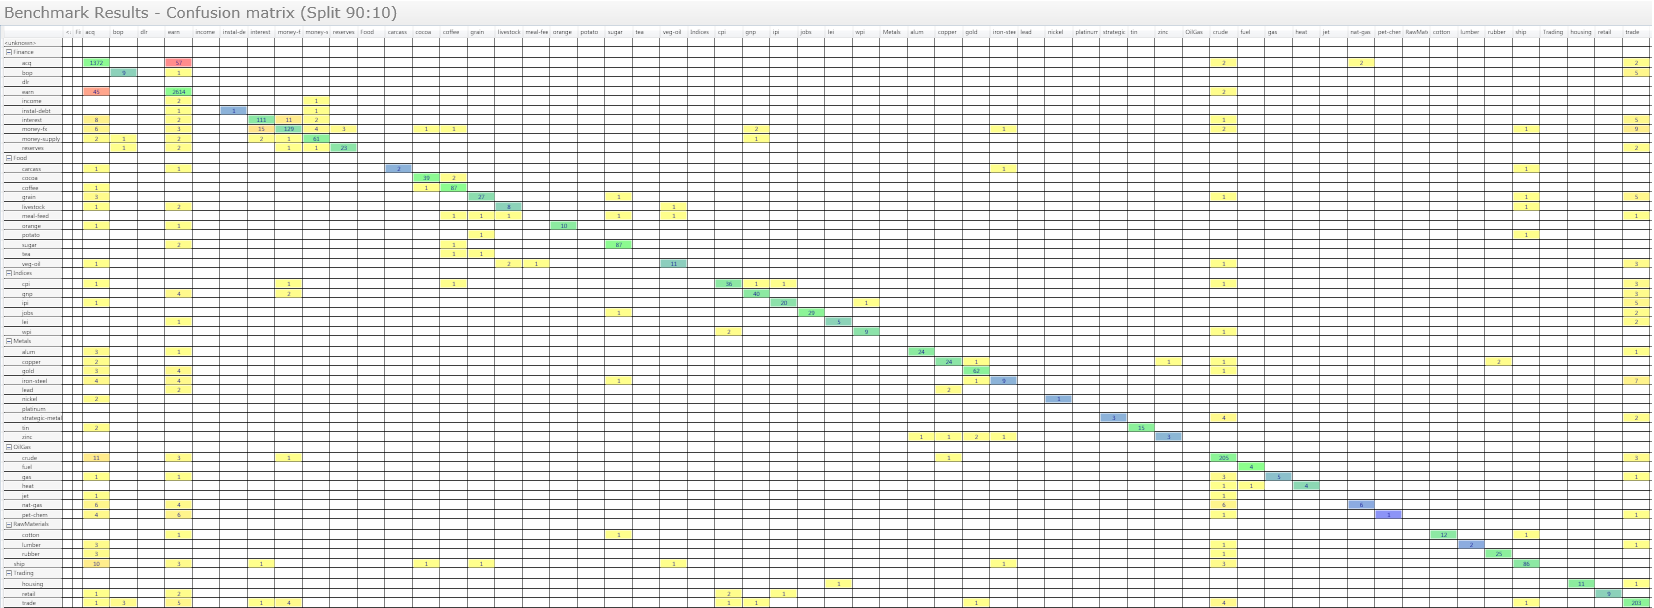
Each column of the matrix represents the instances in a predicted class, while each row represents the instances in an actual class. Of course the user interface allows you to zoom in to look at the details.
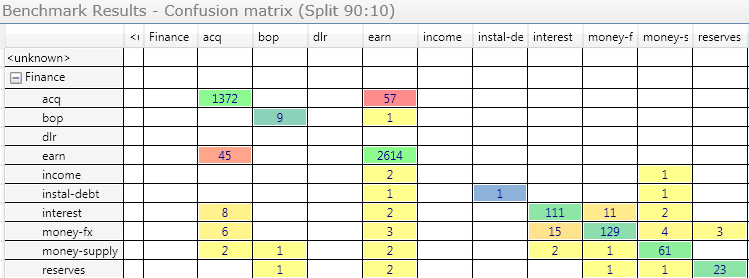
The correctly classified documents are summed up on the diagonal, the exports are on the right upper side and the imports on the left lower side. In our case you see quite some exports from the class “acq”, which is news on acquisitions to “earn”, which is earning. But this is to be expected as these classes are close by topic and often a report on acquisition talks about the same topics (shares, revenue, board) as for earnings. The user can now use this display to click on the box of the 57 exported documents, open them in a list and review them to improve classification if desired. Such it becomes easy to drill down into the results and see exactly what can be improved. You will never achieve 100% precision but remember that also manual human classification only achieves 95% on average as proven in experiments.
When the classes are organized in a hierarchy, the confusion matrix by Skilja also allows you to collapse the nodes and look at upper levels only. In this case the values of the hidden subclasses are summed up and shown for the parent class.
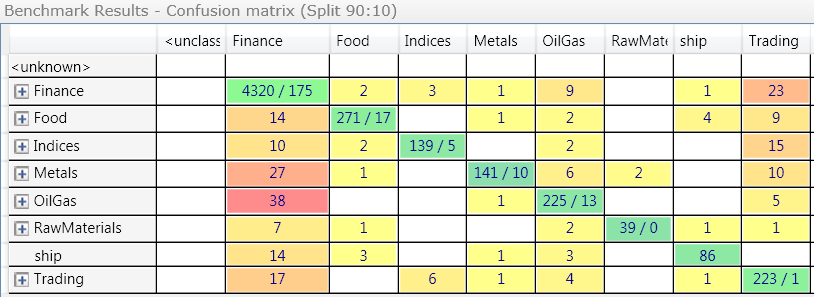
The diagonal has two values now. For example 4.320 of the finance documents have been correctly classified but 175 have been exported/imported within the finance category. Often you are only interested in the migration between the main parent classes, while errors under one parent are less problematic.
Typically an organisation can assign a cost with each export and import. The cost can be different for each pair of classes where this happens. Migrations within a set of subclasses are often not very expensive if they relate for example to documents that anyway are processed in a department. On the other side an import into a class that leads to an automatic payment can be very expensive. This can be mitigated by assigning different thresholds to such classes, which SCC allows. The confusion matrix allows you to find out where these need to be applied. But the matrix can also be exported and you can apply your own cost matrix to the results to determine, which improvement make sense. We are currently working with a real client to create a case study that shows these numbers in a real world example at an insurance company. When available, this study will be published here. Stay tuned!