
For an active production system, but also when the classification scheme is set up, it is very important to measure the quality of the classification. The goal is to create as few as possible errors in classification (also called false positives) as these can severely impact business processes. It must be clear that automatic classification systems, in the same way as human operators, will always make a certain amount of errors. By measuring the performance the error can be quantified and minimized. The error rate from automatic classification must at least match human error rate which has been measured to be about 4% for complex classification tasks.
The question is how classification quality can be measured. Often vendors give you ONE number: “Our success rate is 95%!” If you see this you can as well walk away. It is a useless statement. First it does not tell you how the success is measured. Secondly it does not say anything about errors or false positives. Quality of any recognition system always needs to be characterized with two numbers. Let me give you an explanation of what you need to ask for:
Quality of classification is measured using precision and recall testing a reference set that has been manually defined and tagged. While precision gives the percentage of documents that have been classified correctly with respect to all classified documents, recall is the number of documents classified into a class with respect to the total number of documents in the reference set of this class.
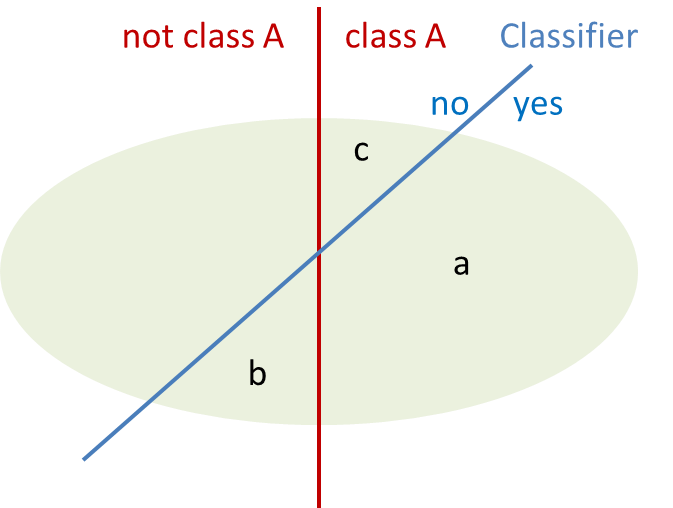
In a simple graph, these sets can be shown: The quality is first determined for one class. All documents of the reference set in the light green ellipse are divided into two sets: The documents that belong to class A – and the documents that do not belong to class A. These sets are defined by the red line and are established by manually tagging the documents in the reference set. The classifier, however, will perform a slightly different separation depicted by the blue line. After the classification of all documents in the set we arrive with 3 subsets: “a” contains all correctly classified documents, “b” the incorrectly classified documents and “c” the documents that should have been classified into class A but were not recalled. Using these sets the following quality measures are defined: Precision = a / (a+b) and Recall = a / (a+c). To obtain a global value of quality for the complete taxonomy the weighted averages of all classes are used (also called micro average).
In document input, a precision of more than 95% is desirable in most cases. Normally this cannot be achieved without introducing a threshold that limits the results to documents that are above the predefined confidence for classification. The threshold can be defined for each class and has the effect to create another subset of documents, the rejected or unknown documents.
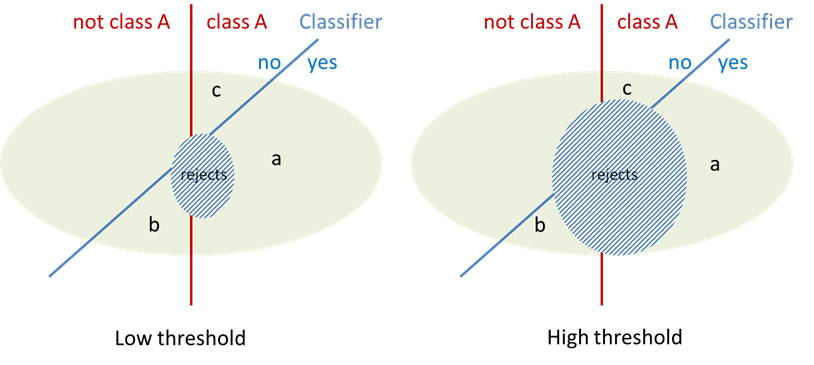
The threshold will reduce the false positives (set b). The higher the required confidence, the fewer documents are erroneously classified. Unfortunately the threshold will also reduce the number of correctly (but less confidently) classified documents as is shown in the graph. A good classifier is characterized by reducing the false positives faster than the true positives thus increasing precision faster than decreasing recall.
In a pragmatic setup the designer of the classification scheme will set precision to the value as obtained in manual classification which is about 96%. The resulting recall (which could be around 80%) is a direct measure for the productivity gain of the automated classification system as all the rejects must be manually classified as before. In certain cases it is necessary to have a higher precision (e.g. for sensitive documents) or a higher recall might be preferred. The threshold allows you to choose the desired scenario.
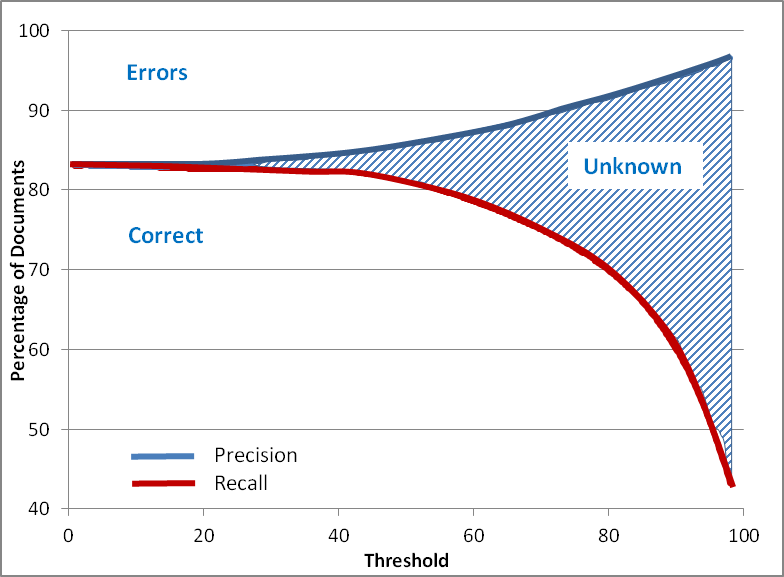
The relation between precision and recall for the complete document set can be shown in the precision-recall graph. Here the respective percentages of false positives and correctly classified documents in a tagged reference set are depicted as a function of the selected threshold. With a threshold of zero recall and precision are obviously identical as every document that is not recalled correctly in one class will appear as a false positive in another class. With the introduction of thresholds false positives will be avoided but also the recall will be reduced. A good classifier shows a steady gradient of the curves with no bumps and will allow the system designer to precisely select the threshold as required by the business needs of the organization.