
This is the fourth and final post on the characteristics of a good content based classifier. In previous posts we have focused on presentation of statistical results and comparison of the Skilja Classifier to a plain vanilla naïve Bayes classifier in Recall-Precision Graphs or Overlap-Separation Graphs. The first article very clearly showed the significant differences of classification results for a complete test set of documents. The second article above focused on the graphical representation for two selected classes, drilling more into details of the results and revealing the strengths and weaknessed of the classifiers.
Both representations are provided with the goal of making the system of auto-classification transparent and understandable to the user – on different levels of detail. Because users feel uneasy if they are presented with a black box and do not understand the decisions of an auto-classifier. Therefore explaining and displaying a result is of high importance in each classifier implementation to achieve user acceptance. This is why Skilja has put such a high emphasis in the visual representation of the result.
The last level of detail, after having looked at global results and the comparison on class level, is the view on single documents. As you have learned from previous posts (e.g. Classification Methods) the classifier determines so-called features that are used to establish the similarity of any given document with a trained class. While these features are complex mathematical structures in a highly dimensional feature space – they can be made visible for a single document. Skilja Content Classifier can display the features by highlighting the words and groups of words in the document that are used to calculate the features. Let me add a word of caution: There are a lot of classifiers out there that simply use these words (bag of word approach) as features. This is not a very good choice as quality will be inferior. Skilja Content Classifier uses other features (like morphemes, correlations and compounds), but for display we show the words that best represent the features chosen as this can be understood best. So do not be misled by the display.
As an example you can see below the classification features used for classifying a document from the Reuters test set on the topic of acquisitions.
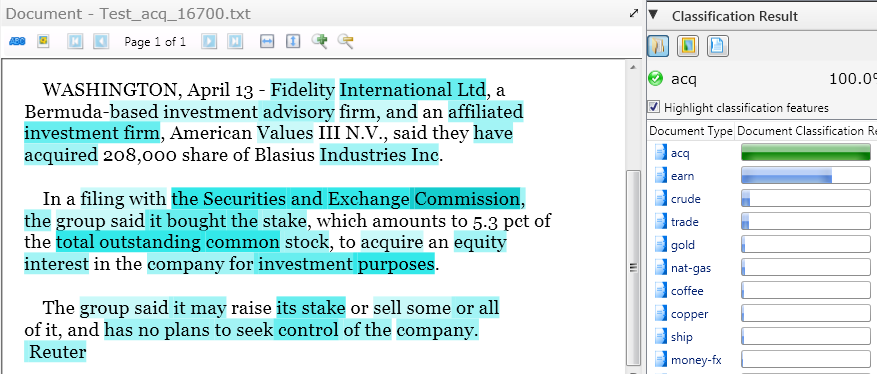
The right side shows the result with a high confidence for the class “acq” representing acquisitions. The features are highlighted in turquoise in in the image. The darker the color, the more relevant the feature. Not surprisingly (and allowing the user to agree with the result) the main features used are “investment firm”, “SEC”, “stock”, “stake” etc. – all of which you would associate with acquisitions yourself. Remember that the features have been automatically generated by machine learning of a few hundred examples. But it helps enormously to generate trust from the user that the system works well. In addition we allow to manually deselect features, but do not recommend to do so, as usually the results deteriorate after manual intervention.
The next series of images shows the example of the same document (on coffee) with the features for the classes “coffee”, “trade” and “crude” which are the top three confidences in the result.
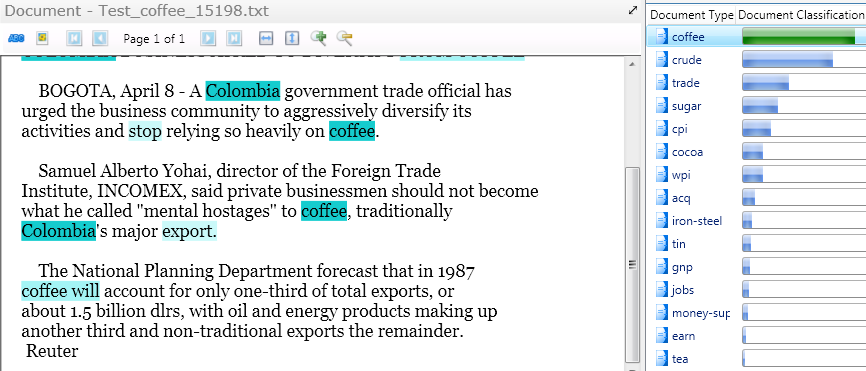
Top hit for coffee document with expected features like “Columbia”, “coffee” and “export” which especially in the correlation and context in which they are used lead to the “coffee” class being selected as best result.
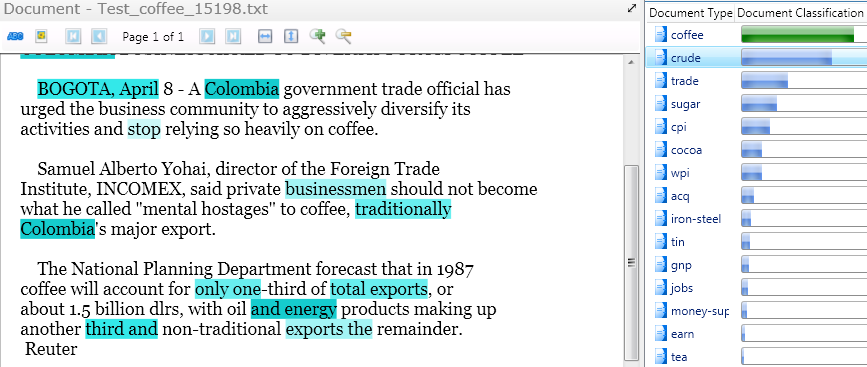
Second best hit of coffee document as “crude (oil)”. Crude also comes from Columbia but crude features like “energy” cannot beat the coffee result
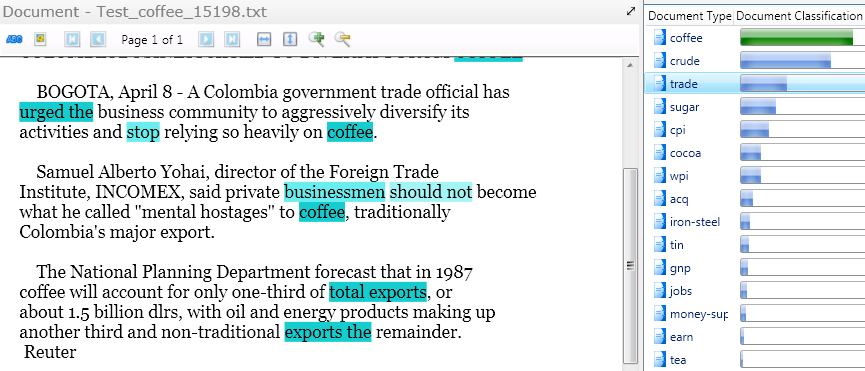
Third best hit of coffee document from “trade” class – result coming from “total exports”, “business” etc. but already far away from the actual coffee topic
By now it should become very obvious how important it is to actually see what the classification algorithm decides and why it decides. Although the intricate details of the math involved are still well hidden it helps a lot in customer projects in the acceptance of machine learning techniques. Together with the overall statistical performance analysis a transparent visualization of the inner workings is what makes a good classifier.